Building for the four types of cyclists
Cities that build bike routes for everyone see huge benefits, with 20% or more of trips by bike
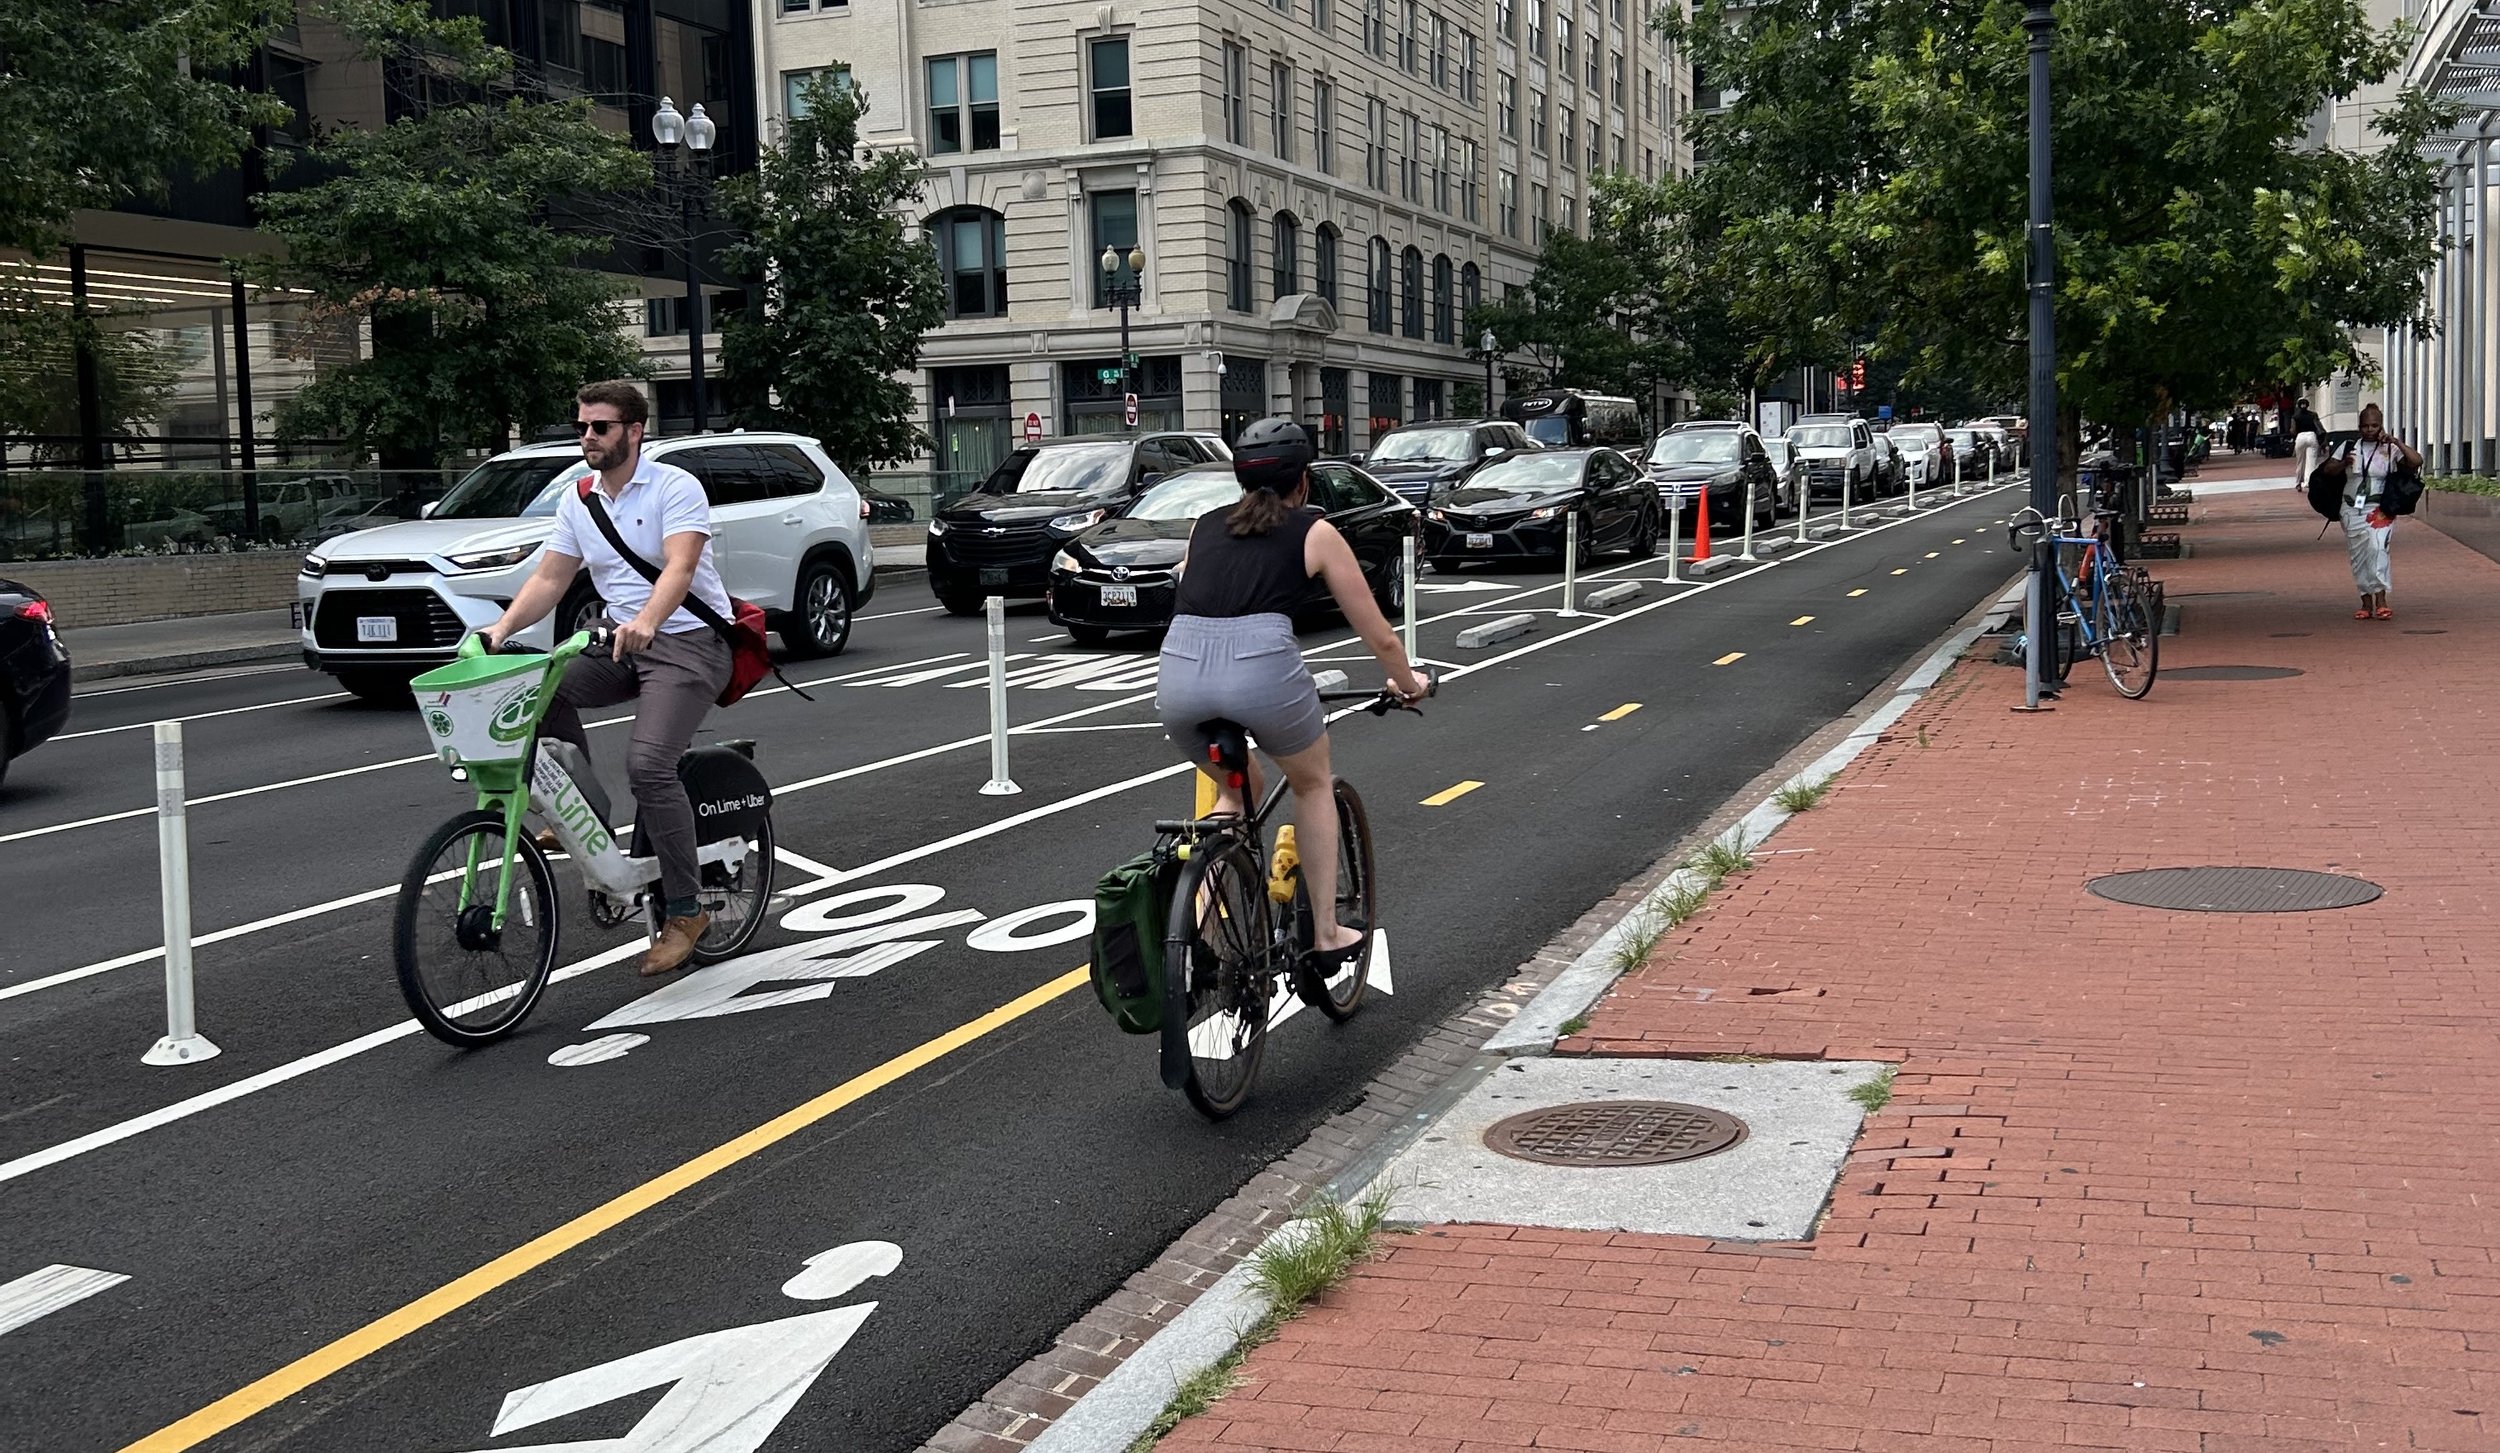
Image: Protected bike lane in Washington, DC in 2024. Bike lanes like these enabled thirty million bike trips last year in the District. Credit: Jonah Kanner
Cities that build safe bike routes have more bike trips. A LOT more.
Cities around the world vary in how street space is used. Cities that design streets to include safe spaces for walking and biking see a LOT more walking and biking. In some cities, 20-40% of trips involve a bicycle. Imagine reducing traffic in Los Angeles by 20%!
In contrast, many American cities have less than 1% of trips involving a bike, with the vast majority by car instead. Why? What’s the difference?
Personally, I don’t believe that residents of Copenhagen or Portland are born with super-human fitness levels. I don’t believe it’s culture or somehow inherent to the society. I believe people are pretty much the same around the world.
What’s different between cities is the streets. Are they built only for high speed cars, or are they built to accommodate everyone?
Researchers sometimes divide the different attitudes of people towards biking into four broad categories. I think we can use this framework to look at different cities, and understand which cyclists they support - or not.
The four types of cyclists
This chart shows that most people are "interested but concerned" in how they think about biking. They would like to ride a bike, but need safe places to do so. Image adopted from a "Equitable bike share means building better places for people to ride (NACTO)".
Strong and Fearless
Strong and fearless cyclists will bike on nearly any road, and they don’t care how fast the cars are going. Cyclists like this aren’t afraid of cars, but they represent a very small fraction of the American population. Most surveys put just a few percent of Americans in this category.
Enthused and Confident
Some people have discovered the joy of biking around their own city, but make a great effort to stay away from the highways and busier streets. You might picture a parent biking with kids or a bike commuter (I am both!). These riders will accept some stress on the street and will work to find safer routes where possible, but can be scared away by highways or high traffic streets. These riders represent somewhere around 4-8% of Americans.
Interested but Concerned
This is by far the largest category, including 50-60% of Americans. People in this category will ride a bike, but only when it feels safe or comfortable. People in this category might be happy to ride on a trail or bike path, but would never consider riding on a busy street with fast moving traffic.
No Way, No How
Some people don’t want to ride a bike or can’t, no matter what the circumstances. This category includes 30% of Americans.
The three types of cities
Keeping the four types of cyclists in mind, we can look at examples of cities around the world that provide for these different levels of comfort.
120 cities are built for everyone
Most Americans are “interested but concerned” about biking. So, building routes that are comfortable for this group is essential for mobility. Fortunately, there are LOTS of cities that have already done this! For example, there are 120 cities around the world where cycling is included in more than 10% of trips, including 60 cities where cycling is included in 20-50% of trips. Attracting these rates of cycling has huge benefits for these cities. It promotes economic growth, cleaner air, quieter neighborhoods, saves people money, improves health, and of course reduces traffic. These cities almost always include a network of protected bike lanes and/or off-street biking paths. That network might also include some, or many, slow streets designed for speeds under 20 MPH.
These 120 cities have figured out how to build bike routes safe enough for the “interested but concerned,” and are getting huge benefits. We can learn from their example!
Publications like NACTO’s Designing for All Ages and Abilities , the FWHA Bikeway Selection Guide , and the CalTrans Complete Streets Guidance set guidelines on how to build for all riders in an American context.
70 cities for the enthusiastic and confident
Some cities have made an effort to make cycling more accessible, but have only done the job part of the way. These cities enable enthusiastic riders to use their bikes, but most people still feel unwelcome biking on the street. These cities might have some biking streets, but they might not connect to form a network, and they might have trouble spots where bike lanes are unprotected or suddenly disappear.
Examples of these are 70 cities where biking is used in 4-10% of trips. They’ve made a great start, and they are already seeing real benefits from fewer collisions and less car traffic. This list includes a number of American cities, including Washington, D.C., Boulder, CO, Mountain View, CA, and Cambridge, MA. In Palo Alto, CA, around half of students ride their bikes to school, so hundreds of busy parents are saving valuable time every morning. In Washington, DC, there is a sharp rise in bike ridership as the District adds more bike lanes. Depending on which data set you check, our own Pasadena might already be in this category, with an estimated 2-4% of trips by bike.
Many cities are built only for cars
Unfortunately, many American cities are built only for cars, and have streets that are very hostile to bikes. These cities see biking rates around 1% of trips (or less!). If there’s nowhere for people to ride a bike, then they will take a car instead. This creates many problems for these cities, including traffic and the time it wastes, air pollution, noise, and crashes that result in injuries and deaths. Also, the need to drive for every trip creates a huge financial burden, costing Americans an average $12,000 per year per car.
Making space for bikes leaves plenty of room for driving
For some trips, biking is not an option. In all of the biking cities around the world, there is still also a network of streets for moving cars. The goal of building a biking city is to create transportation options. Using 10% or 20% of street space to add bike routes still leaves plenty of room for cars.
When streets change, so do travel habits
The most important lesson from other cities may be: people can change their habits. When cities change their use of street space to include space for safe biking, more people will use this option. As recently as the 1970’s, Amsterdam was choked with car traffic. Now, biking is a normal way to move around the city, along with driving and public transit. More recently, both London and Paris have made changes to make biking easier, and they both now report more trips by bike than by car. These changes have happened in just the past few years, and these cities have plans to do more. Closer to home, Santa Monica, CA adopted a bike action plan in 2011, and saw cycling rates jump by 65% from 2011 to 2018.
Here in Pasadena, we are starting to see some progress. In 2023 new bike lanes were added both on Cordova and on Union Street. These improvements are already making biking safer and more accessible. By adding additional routes, Pasadena can create a connected network of safe bike routes, and gain the many benefits of a transportation system that works for everyone.
References and notes
Data on cycling mode share adopted from: https://cityclock.org/blogs/cycling-mode-share-data-700-cities-40-countries
Additional data, including mode share in various cities, are available in the brochure “Cycling Facts 2023” by the government of the Netherlands. Cycling Facts
In Santa Monica, the Bike Action Plan amendment shows that cycling rates jumped from 2.4% in 2011 to 4.0% in 2018.
Research on the four types of cyclists are available at: https://jenniferdill.net/types-of-cyclists/ and https://doi.org/10.3141/2587-11
Cycles Outnumber Cars In City Of London, Forbes, July 11, 2023
Cyclists Now Outnumber Motorists In Paris, Forbes, April 6, 2024
Biking in Santa Monica grew 67% in 7 years, Santa Monica Bike Plan
Biking is “normal” in Washington, DC Greater, Greater Washington, August 28, 2024
Biking outpaces transit in Washington, DC, Planetizan, September 4, 2024
Half of students bike to school in Palo Alto, CA , Palo Alto Online, April 26, 2023


